Author

Francis Ndungu
On this Page
How to Monitor Ubuntu 26.04 Server Metrics with Prometheus and Grafana
07 May, 2026
Introduction
Prometheus is an open‑source monitoring system that collects time‑series metrics from configured targets at specified intervals. It stores all data as time‑series streams, where each stream carries a metric name and key‑value pairs called labels. Grafana is an interactive visualization platform that connects to Prometheus as a data source, allowing you to create dashboards, graphs, and alerts based on your server metrics. Together, these tools provide a complete observability stack for tracking CPU usage, memory consumption, disk activity, network throughput, and system load on Ubuntu servers.
This guide explains how to install, configure, and connect Prometheus and Grafana to monitor Ubuntu 26.04 server metrics.
Prerequisites
Before you start:
- Purchase an Ubuntu 26.04 VPS (Virtual Private Server) . If you don't have an Ubuntu VPS, sign up with Vultr and get upto $300 worth of free credit to test the Vultr platform.
-
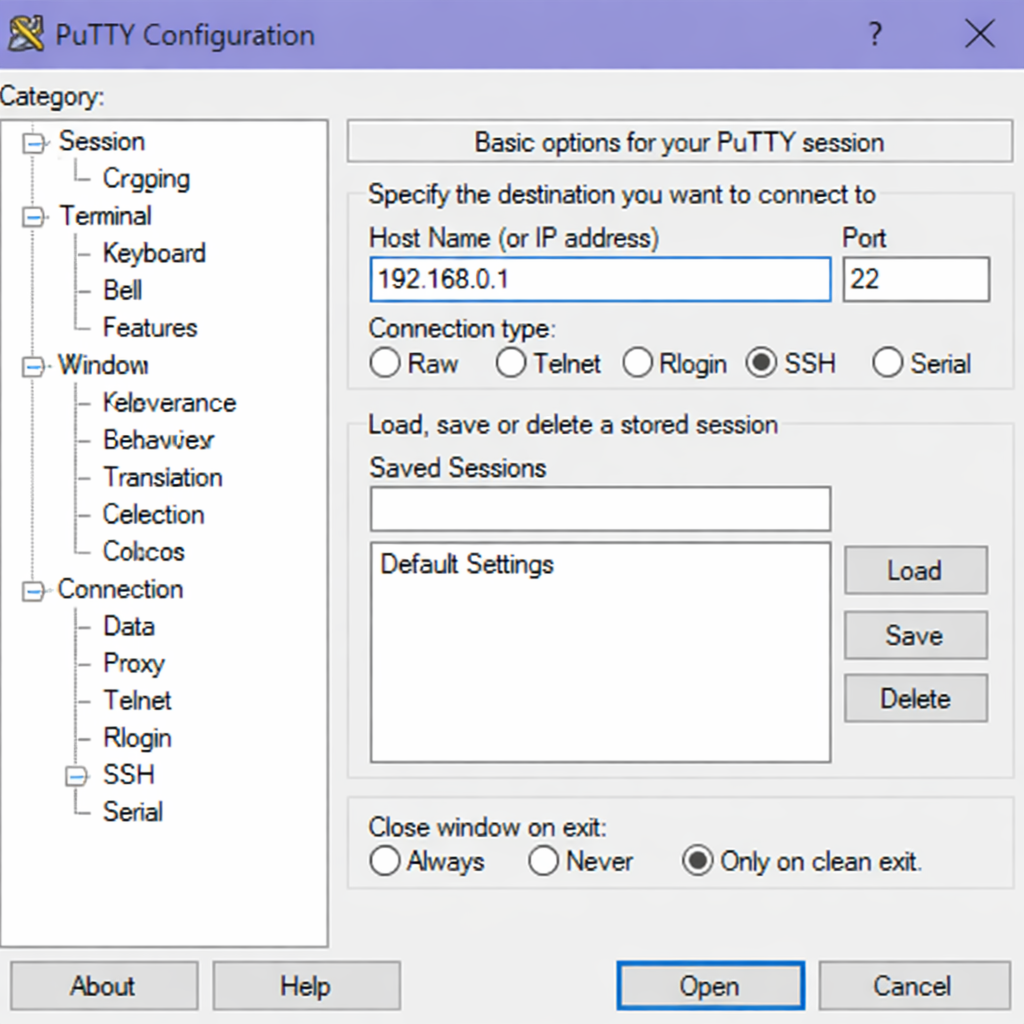
Connect to your server through SSH, replace
192.168.0.1with your VPS public IP address..-
Use PuTTY to connect to your VPS .
-
Run the following command in your shell.
console$ ssh username@192.168.0.1
-
-
Create a non-root user with sudo privileges. Read our guide on How to Create a Non-Root Sudo User on Ubuntu 24.04. You'll use this user's account to run the commands in this guide.
Install Prometheus
Prometheus provides pre‑compiled binaries for Linux systems. This section covers downloading, installing, and configuring the Prometheus server.
-
Refresh your system package list to get the latest available versions.
console$ sudo apt update -
Install
wgetandcurlutilities for downloading files.console$ sudo apt install -y wget curl tar -
Create a dedicated system user for Prometheus without login capabilities.
console$ sudo useradd --no-create-home --shell /bin/false prometheus -
Create directory structures for Prometheus configuration and data.
console$ sudo mkdir -p /etc/prometheus /var/lib/prometheus -
Navigate to a temporary directory for downloading the Prometheus archive.
console$ cd /tmp -
Download the latest stable release of Prometheus version 2.53.0 for Linux AMD64.
console$ wget https://github.com/prometheus/prometheus/releases/download/v2.53.0/prometheus-2.53.0.linux-amd64.tar.gzOutput:
--2026-05-04 10:15:23-- https://github.com/prometheus/prometheus/releases/download/v2.53.0/prometheus-2.53.0.linux-amd64.tar.gz Resolving github.com... 140.82.112.3 Connecting to github.com... connected. HTTP request sent, awaiting response... 200 OK Length: 94371840 (90 MB) Saving to: 'prometheus-2.53.0.linux-amd64.tar.gz' -
Extract the downloaded archive.
console$ tar xvf prometheus-2.53.0.linux-amd64.tar.gz -
Copy the Prometheus binary to the system binary directory.
console$ sudo cp prometheus-2.53.0.linux-amd64/prometheus /usr/local/bin/ -
Copy the Prometheus configuration file to the configuration directory.
console$ sudo cp prometheus-2.53.0.linux-amd64/prometheus.yml /etc/prometheus/ -
Copy the console templates and libraries to the configuration directory.
console$ sudo cp -r prometheus-2.53.0.linux-amd64/consoles /etc/prometheus/ -
Set ownership of the Prometheus directories to the prometheus user.
console$ sudo chown -R prometheus:prometheus /etc/prometheus /var/lib/prometheus -
Set ownership of the Prometheus binary to the prometheus user.
console$ sudo chown prometheus:prometheus /usr/local/bin/prometheus
Configure Prometheus
Prometheus uses a YAML configuration file to define which targets to scrape and how frequently to collect metrics.
-
Open the main Prometheus configuration file using the nano text editor.
console$ sudo nano /etc/prometheus/prometheus.yml -
Replace the existing configuration with the following content. This configuration scrapes metrics from the Prometheus server every 15 seconds.
YAMLglobal: scrape_interval: 15s evaluation_interval: 15s alerting: alertmanagers: - static_configs: - targets: [] rule_files: [] scrape_configs: - job_name: "prometheus" static_configs: - targets: ["localhost:9090"] -
Save and close the
/etc/prometheus/prometheus.ymlfile by pressing Ctrl + X, then Y, then Enter. -
Validate the Prometheus configuration syntax.
- Install
promtool:
console$ sudo apt install -y promtool- Run the configuration check:
console$ promtool check config /etc/prometheus/prometheus.ymlOutput (example):
Checking /etc/prometheus/prometheus.yml SUCCESS: 0 rule files found - Install
Create a Prometheus Systemd Service
Running Prometheus as a systemd service ensures the monitoring server starts automatically after system reboots.
-
Create a new systemd service file using the nano text editor.
console$ sudo nano /etc/systemd/system/prometheus.service -
Add the service configuration to the new
prometheus.servicefile.INI[Unit] Description=Prometheus Monitoring Server After=network.target [Service] User=prometheus Group=prometheus Type=simple ExecStart=/usr/local/bin/prometheus \ --config.file=/etc/prometheus/prometheus.yml \ --storage.tsdb.path=/var/lib/prometheus \ --web.console.templates=/etc/prometheus/consoles \ --web.console.libraries=/etc/prometheus/console_libraries Restart=always RestartSec=10 [Install] WantedBy=multi-user.target -
Save and close the
/etc/systemd/system/prometheus.servicefile by pressing Ctrl + X, then Y, then Enter. -
Reload the systemd manager to recognize the new service.
console$ sudo systemctl daemon-reload -
Enable the Prometheus service to start at boot.
console$ sudo systemctl enable prometheusOutput:
Created symlink /etc/systemd/system/multi-user.target.wants/prometheus.service → /etc/systemd/system/prometheus.service. -
Start the Prometheus service.
console$ sudo systemctl start prometheus -
Check the Prometheus service status to confirm it runs correctly.
console$ sudo systemctl status prometheusOutput:
● prometheus.service - Prometheus Monitoring Server
     Loaded: loaded (/etc/systemd/system/prometheus.service; enabled; preset: enabled)
     Active: active (running) since Mon 2026-05-04 10:25:12 UTC; 45s ago
   Main PID: 12456 (prometheus)
      Tasks: 8 (limit: 1024)
     Memory: 48.2M
        CPU: 1.234s
     CGroup: /system.slice/prometheus.service
             └─12456 /usr/local/bin/prometheus --config.file=/etc/prometheus/prometheus.yml --storage.tsdb.path=/var/lib/prometheus
Install the Node Exporter
The Node Exporter exposes hardware and operating system metrics from Linux servers. Prometheus scrapes these metrics to monitor CPU, memory, disk, and network statistics.
-
Create a dedicated system user for Node Exporter without login capabilities.
console$ sudo useradd --no-create-home --shell /bin/false node_exporter -
Navigate to the temporary directory for downloading Node Exporter.
console$ cd /tmp -
Download the latest stable release of Node Exporter version 1.8.0 for Linux AMD64.
console$ wget https://github.com/prometheus/node_exporter/releases/download/v1.8.0/node_exporter-1.8.0.linux-amd64.tar.gzOutput:
--2026-05-04 10:30:45-- https://github.com/prometheus/node_exporter/releases/download/v1.8.0/node_exporter-1.8.0.linux-amd64.tar.gz Resolving github.com... 140.82.112.3 Connecting to github.com... connected. HTTP request sent, awaiting response... 200 OK Length: 12345678 (12 MB) Saving to: 'node_exporter-1.8.0.linux-amd64.tar.gz' -
Extract the downloaded archive.
console$ tar xvf node_exporter-1.8.0.linux-amd64.tar.gz -
Copy the Node Exporter binary to the system binary directory.
console$ sudo cp node_exporter-1.8.0.linux-amd64/node_exporter /usr/local/bin/ -
Set ownership of the Node Exporter binary to the node_exporter user.
console$ sudo chown node_exporter:node_exporter /usr/local/bin/node_exporter
Create a Node Exporter Systemd Service
Running Node Exporter as a systemd service ensures metric collection starts automatically and continues running in the background.
-
Create a new systemd service file using the nano text editor.
console$ sudo nano /etc/systemd/system/node_exporter.service -
Add the service configuration to the new
node_exporter.servicefile.INI[Unit] Description=Prometheus Node Exporter After=network.target [Service] User=node_exporter Group=node_exporter Type=simple ExecStart=/usr/local/bin/node_exporter [Install] WantedBy=multi-user.target -
Save and close the
/etc/systemd/system/node_exporter.servicefile by pressing Ctrl + X, then Y, then Enter. -
Reload the systemd manager to recognize the new service.
console$ sudo systemctl daemon-reload -
Enable the Node Exporter service to start at boot.
console$ sudo systemctl enable node_exporterOutput:
Created symlink /etc/systemd/system/multi-user.target.wants/node_exporter.service → /etc/systemd/system/node_exporter.service. -
Start the Node Exporter service.
console$ sudo systemctl start node_exporter -
Check the Node Exporter service status to confirm it runs correctly.
console$ sudo systemctl status node_exporterOutput:
● node_exporter.service - Prometheus Node Exporter
     Loaded: loaded (/etc/systemd/system/node_exporter.service; enabled; preset: enabled)
     Active: active (running) since Mon 2026-05-04 10:35:22 UTC; 30s ago
   Main PID: 12567 (node_exporter)
      Tasks: 4 (limit: 1024)
     Memory: 12.5M
        CPU: 0.234s
     CGroup: /system.slice/node_exporter.service
             └─12567 /usr/local/bin/node_exporter
Configure Prometheus to Scrape Node Exporter
Prometheus needs configuration changes to collect metrics from the Node Exporter endpoint.
-
Open the Prometheus configuration file using the nano text editor.
console$ sudo nano /etc/prometheus/prometheus.yml -
Add a new scrape configuration for the Node Exporter under the
scrape_configssection. Place this after the existing prometheus job.YAML- job_name: "node_exporter" static_configs: - targets: ["localhost:9100"] -
Review the complete configuration file to ensure both jobs exist.
YAMLglobal: scrape_interval: 15s evaluation_interval: 15s alerting: alertmanagers: - static_configs: - targets: [] rule_files: [] scrape_configs: - job_name: "prometheus" static_configs: - targets: ["localhost:9090"] - job_name: "node_exporter" static_configs: - targets: ["localhost:9100"] -
Save and close the
/etc/prometheus/prometheus.ymlfile by pressing Ctrl + X, then Y, then Enter. -
Restart the Prometheus service to load the new configuration.
console$ sudo systemctl restart prometheus
Install Grafana
Grafana provides a web‑based interface for visualizing Prometheus metrics. The official Grafana repository contains the latest stable packages for Ubuntu.
-
Install prerequisite packages for adding a new repository.
console$ sudo apt install -y software-properties-common apt-transport-https curl gpg -
Add the Grafana GPG key to verify package signatures (stored in dearmored
.gpgformat).console$ sudo mkdir -p /usr/share/keyrings -
Add the keyring using curl
console$ curl -fsSL https://apt.grafana.com/gpg.key | sudo gpg --dearmor -o /usr/share/keyrings/grafana.gpg -
Add the stable Grafana repository to your system sources.
console$ echo "deb [signed-by=/usr/share/keyrings/grafana.gpg] https://apt.grafana.com stable main" | sudo tee /etc/apt/sources.list.d/grafana.listOutput:
deb [signed-by=/usr/share/keyrings/grafana.gpg] https://apt.grafana.com stable main -
Refresh your package list to include the Grafana repository.
console$ sudo apt update -
Install Grafana.
console$ sudo apt install grafana -
Install the Grafana OSS (Open Source Software) package.
console$ sudo apt install -y grafanaOutput:
Reading package lists... Done Building dependency tree... Done Reading state information... Done The following NEW packages will be installed: grafana 0 upgraded, 1 newly installed, 0 to remove and 0 not upgraded. Need to get 85.2 MB of archives. After this operation, 312 MB of additional disk space will be used. -
Reload the systemd manager to recognize the Grafana service.
console$ sudo systemctl daemon-reload -
Enable the Grafana service to start at boot.
console$ sudo systemctl enable grafana-serverOutput:
Created symlink /etc/systemd/system/multi-user.target.wants/grafana-server.service → /lib/systemd/system/grafana-server.service. -
Start the Grafana service.
console$ sudo systemctl start grafana-server -
Check the Grafana service status to confirm it runs correctly.
console$ sudo systemctl status grafana-serverOutput:
● grafana-server.service - Grafana instance
     Loaded: loaded (/lib/systemd/system/grafana-server.service; enabled; preset: enabled)
     Active: active (running) since Mon 2026-05-04 10:45:12 UTC; 1min 22s ago
   Main PID: 12789 (grafana)
      Tasks: 14 (limit: 1024)
     Memory: 89.4M
        CPU: 2.345s
     CGroup: /system.slice/grafana-server.service
             └─12789 /usr/share/grafana/bin/grafana server
Configure Firewall for Prometheus and Grafana
Opening the necessary ports allows you to access the Prometheus web interface and Grafana dashboard from your browser.
-
Allow Prometheus web port 9090 through the firewall.
console$ sudo ufw allow 9090/tcp -
Allow Grafana web port 3000 through the firewall.
console$ sudo ufw allow 3000/tcp -
Reload the firewall to apply the new rules.
console$ sudo ufw reload -
Verify the firewall rules include both ports.
console$ sudo ufw statusOutput:
Status: active

To                         Action      From
--                         ------      ----
22/tcp                     ALLOW       Anywhere
9090/tcp                   ALLOW       Anywhere
3000/tcp                   ALLOW       Anywhere
22/tcp (v6)                ALLOW       Anywhere (v6)
9090/tcp (v6)              ALLOW       Anywhere (v6)
3000/tcp (v6)              ALLOW       Anywhere (v6)
Access and Configure Grafana
Grafana requires initial setup through its web interface. Complete this setup to prepare for connecting Prometheus as a data source.
-
Open a web browser and navigate to
http://your_server_ip:3000.
-
Log in with the default credentials:
- Username:
admin - Password:
admin
- Username:
-
Change the default password when prompted. Enter a secure password and click Submit.
-
Click Add your first data source from the Grafana home page.
-
Select Prometheus from the list of available data sources.
-
Configure the Prometheus connection settings:
- Name: Enter
Prometheus - URL: Enter
http://localhost:9090
- Name: Enter
-
Scroll to the bottom of the page and click Save & Test.
Output:
Data source is working
Import the Node Exporter Dashboard
Grafana provides pre‑built dashboards for visualizing Node Exporter metrics. Importing a community dashboard saves time and provides comprehensive system monitoring.
-
Hover over the import menu in the right sidebar (a plus and a downward facing arrow).
-
Click Import dashboard from the dropdown menu.
-
Enter the dashboard ID
1860in the Import via grafana.com field. This ID corresponds to the official Node Exporter Full dashboard. -
Click Load.
-
Select Prometheus as the data source from the dropdown menu.
-
Click Import.
-
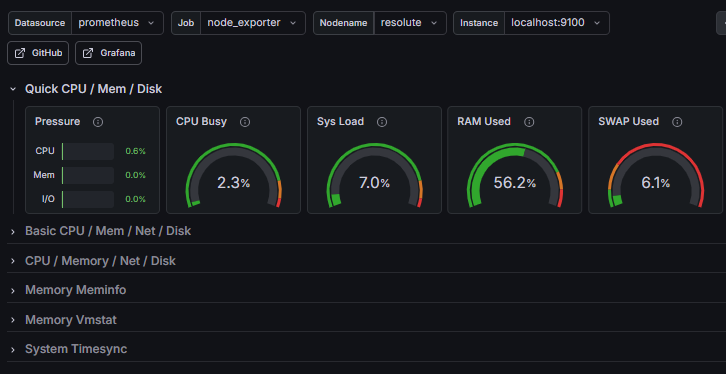
Review the dashboard panels. The dashboard displays metrics including:
- CPU usage and load average
- Memory consumption and swap usage
- Disk space and I/O operations
- Network traffic and connection statistics
- System uptime and running processes
Conclusion
In this guide, you have installed Prometheus and Grafana on Ubuntu 26.04 to monitor server metrics. You configured the Node Exporter to collect hardware and operating system statistics, connected Grafana to Prometheus as a data source, and imported a pre‑built dashboard. Now that your monitoring stack operates correctly, consider adding alerting for disk space thresholds, integrating additional exporters for applications like PostgreSQL or Nginx, or setting up Grafana for multi‑server monitoring across your entire infrastructure.
